Michael Darlan
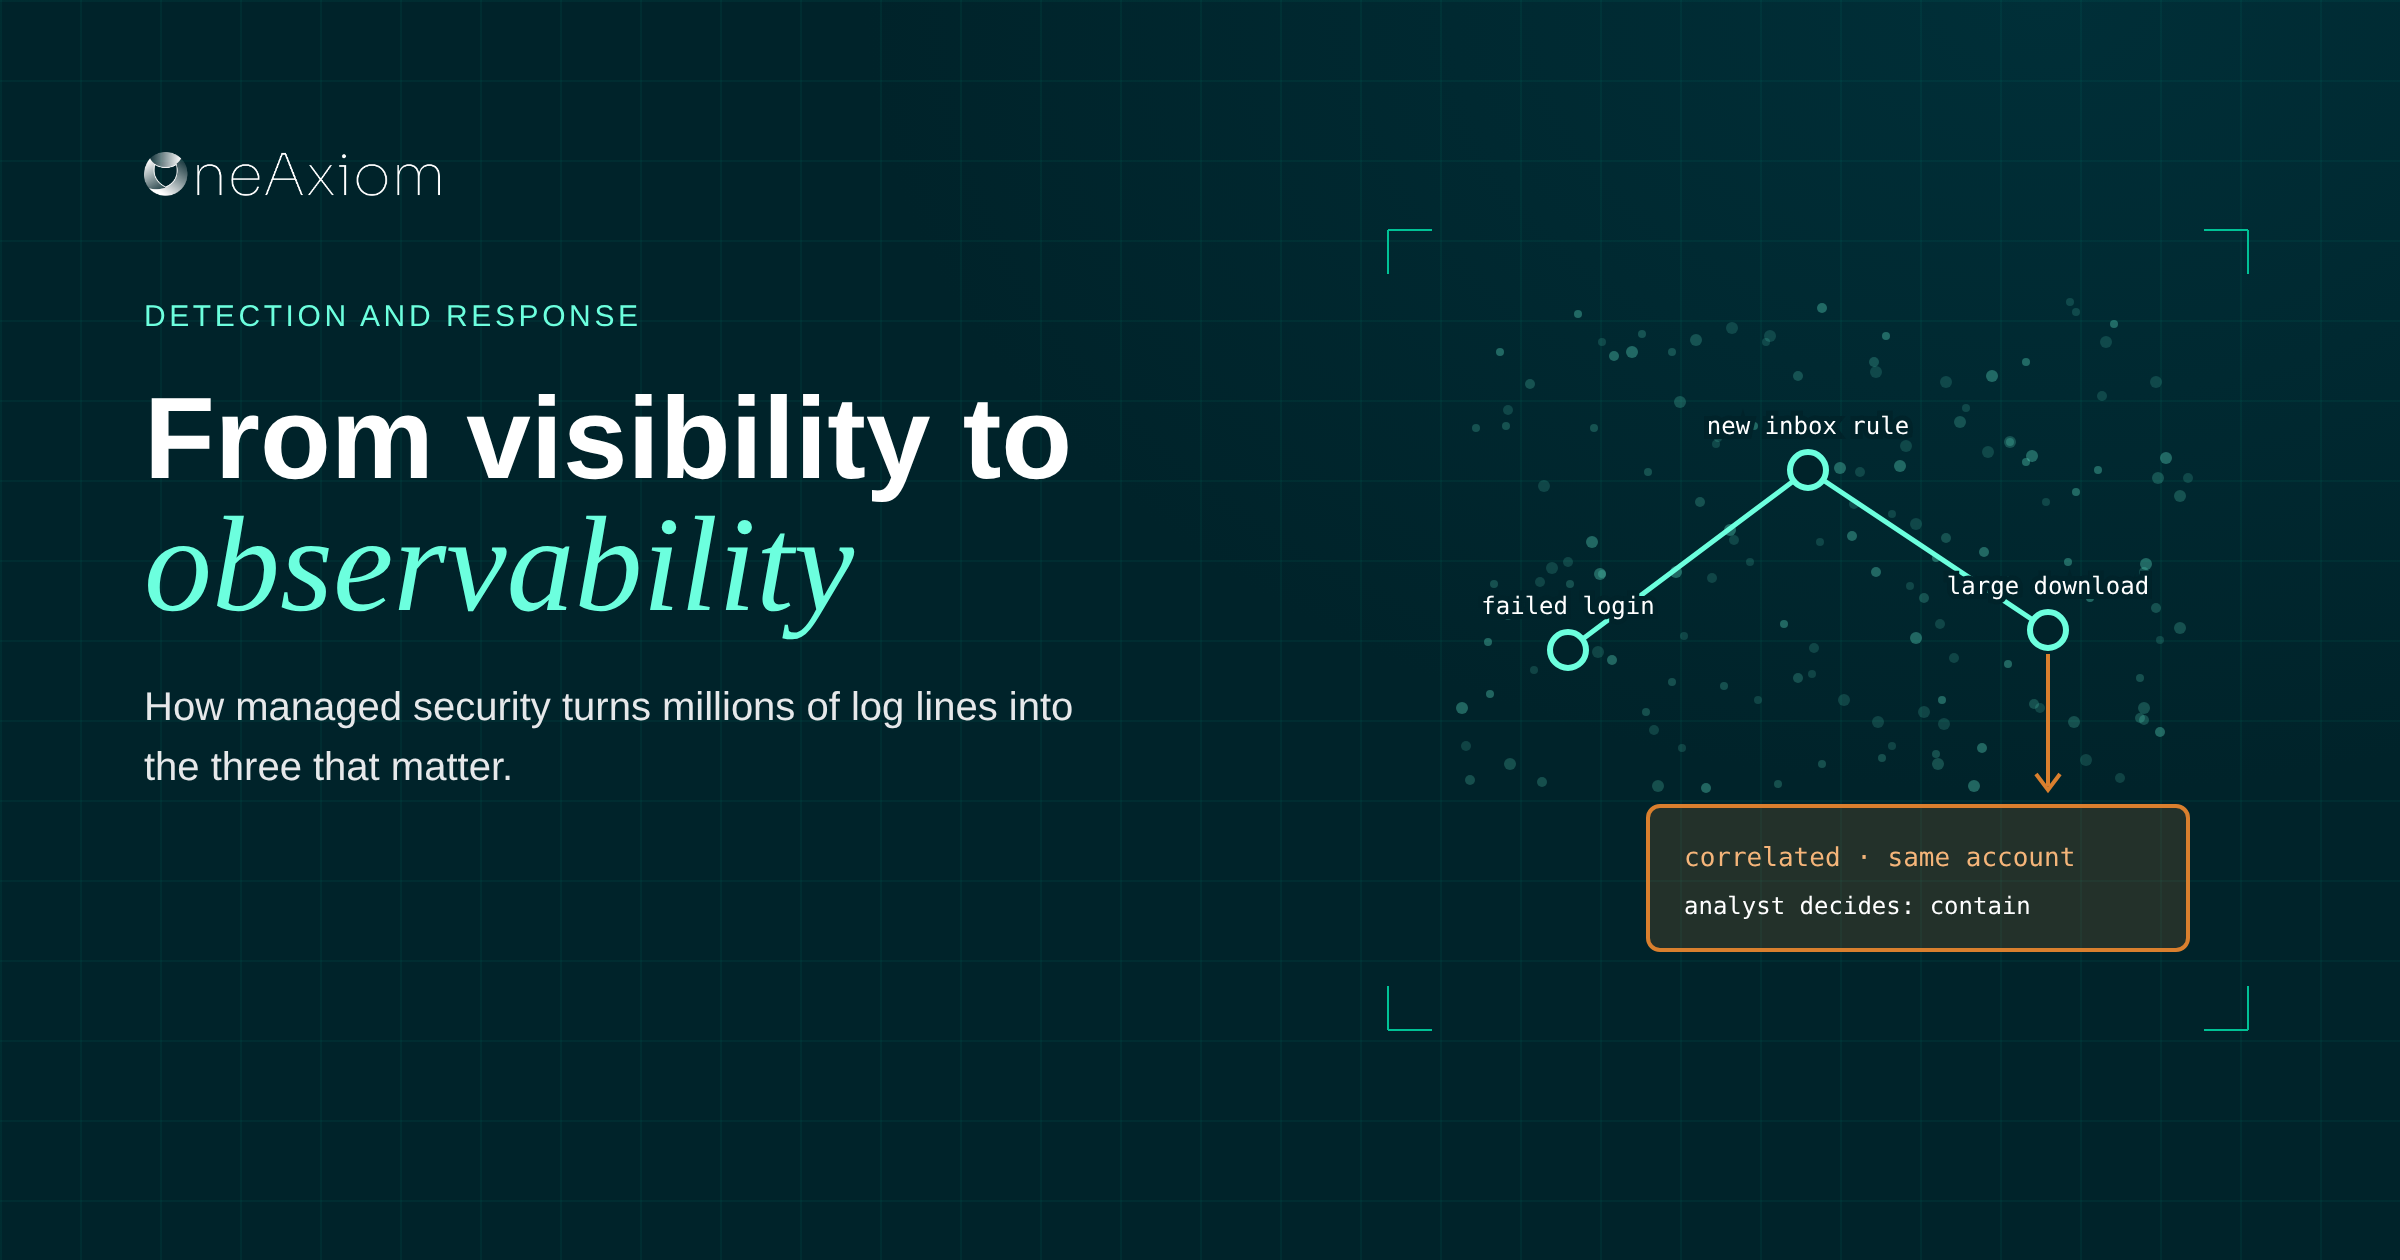

Every security vendor will tell you they give you “full visibility.” Great. You can now see 40 million log lines a day.
What you can’t see is which three of them mean somebody is in your network right now.
The short answer: Visibility means you’re collecting security data. Observability means you can explain what that data is telling you and act on it.
Managed security providers get there by combining telemetry from endpoints, identities, networks and cloud apps, enriching it with context, correlating events over time, and putting a human analyst on the result. The payoff is faster detection, more precise response and less alert fatigue.
What’s the difference between visibility and observability?
Visibility answers “can we see it?” Observability answers “why is it happening, and what do we do?”
Plenty of companies have great visibility on paper. The logs exist. They’re just sitting in five different tools, nobody’s connected them, and the one that mattered was reviewed three days late.
| Visibility | Observability | |
|---|---|---|
| Question it answers | Can we see what’s happening? | Why is it happening, and what should we do? |
| How it works | Collects logs, events and flow data | Connects logs, metrics and traces with context |
| Typical state | Siloed, unanalyzed, often delayed | Correlated, enriched and reviewed |
| What you get | A lot of data | A decision |
| When you find out | After the damage, if at all | While the attack is still in progress |
How telemetry becomes a decision
Most companies stop at step one and call it a day. Observability is everything that happens after.
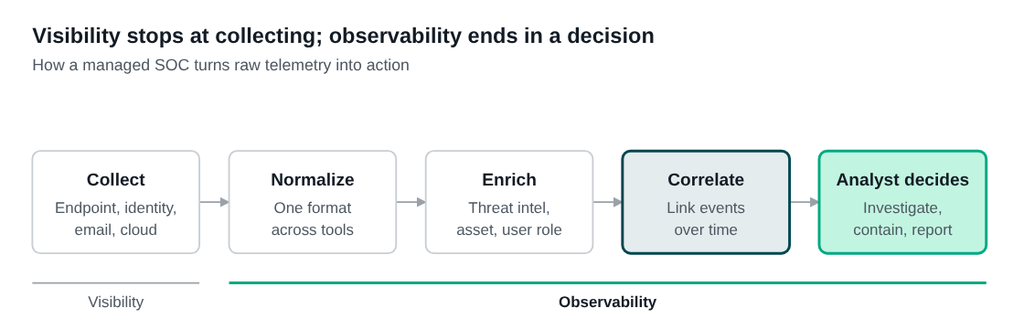
Correlation is the step that catches real attacks. A failed login, a privileged access request and a big data transfer can each look harmless. Lined up within an hour on the same account, they tell you exactly what’s going on.
The telemetry that actually matters
You don’t need every log Windows has ever written. You need the right ones, from the places attackers actually go.
- Endpoints. EDR data on processes, scripts, file changes and network connections. This is where ransomware shows its hand.
- Identity. Sign-ins, MFA prompts, new authentication methods, role changes. Most breaches now start with a real password, so this is where you catch them early.
- Email. Delivery, clicks, reported messages and new inbox rules. The front door for phishing and business email compromise.
- Cloud and SaaS. Admin actions, OAuth app consents and unusual downloads in Microsoft 365, Google Workspace and your other apps.
- Network. Firewall, DNS and flow data. Good for spotting a machine calling a server it has no business talking to.
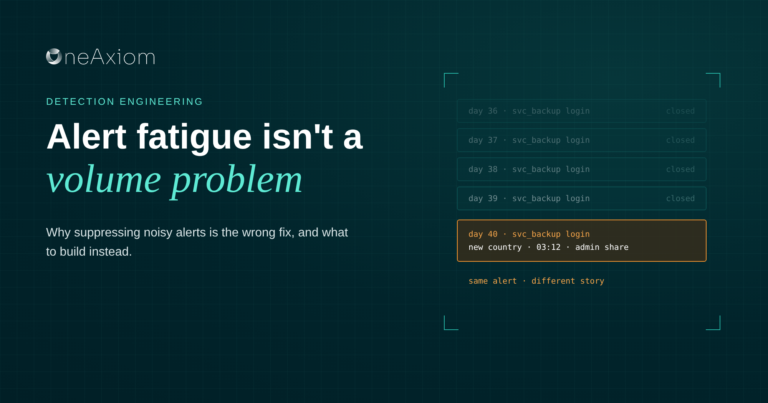
One source on its own tells you very little. A login from a new country is probably someone on vacation. A login from a new country, followed by a new inbox rule, followed by a large download, is a very different Tuesday.
How MSSPs and MDR providers make it work
Observability is hard to build in-house, mostly because of four problems every provider has to solve too.
Volume. Telemetry grows faster than any team can read it. Providers need infrastructure that can ingest, store and search it quickly.
Tool sprawl. Every client runs a different stack. A good provider pulls it all into one picture instead of making you replace what you have.
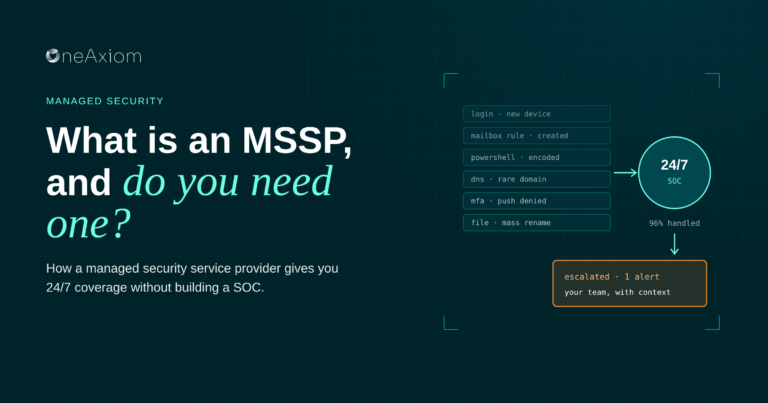
Noise. Most alerts are harmless. Scoring, tuning and analyst workflows decide which ones reach a human. At OneAxiom, 96% of alerts are handled before they ever reach a client’s team.
Context. An analyst who doesn’t know your business can’t tell normal from strange. Providers need baselines, asset criticality and someone who knows that finance runs big exports every month-end.
When it works, you get four things:
- Faster detection. Anomalies surface in minutes instead of days, so attackers have less time inside.
- Precise response. Isolate one process or end one user session, instead of pulling a whole laptop off the network.
- Less alert fatigue. Your team sees fewer, better alerts and trusts the ones they get.
- Better decisions. Trends show which assets get targeted and which controls are earning their budget.
What to ask a provider
- Which telemetry sources do you ingest, and can you work with the tools we already have?
- How many detection rules do you run, and how often are they tuned?
- Who investigates an alert, and how fast? (Our SLA is 30 minutes.)
- Can you respond, or only alert?
- What reporting will show us trends, not just tickets?
Frequently asked questions
What is the difference between visibility and observability in cybersecurity?
Visibility means collecting security data such as logs and events. Observability means correlating and enriching that data so you understand why something is happening and what to do about it.
What is security telemetry?
The data your systems produce about activity: endpoint processes, sign-ins, email events, cloud admin actions and network traffic. Security teams analyze it to detect and investigate threats.
How does MDR use telemetry?
MDR providers collect telemetry from your environment, enrich it with threat intelligence and context, correlate related events, and have analysts investigate and respond to real threats.
Why isn’t more data enough?
More data without correlation and review creates more noise, not more security. The attack is usually in the logs. Nobody connected the dots in time.
Which telemetry sources should I prioritize?
Start with endpoint (EDR), identity and email. Those cover where most attacks begin and spread. Add cloud and network data next.
Stop collecting. Start connecting.
You probably already have most of the data you need. The breach you’re worried about will almost certainly be sitting in your logs. The question is whether anyone connects those dots while it’s happening, or six weeks later during the incident review.
If you’d like to see what your current telemetry is actually telling you, book a call with our team. We’ll walk through your setup and show you where the gaps are, whether or not you work with us.
By Michael Darlan, Cybersecurity Specialist at OneAxiom